Why Metrics Matter in MDM
Organizations can no longer afford to make decisions based on incomplete, inconsistent, or outdated master data. That’s why MDM quality metrics have become mission-critical, not just for IT teams, but for every function that relies on accurate information to operate efficiently.
Whether you’re managing a global supply chain, tracking equipment maintenance, or forecasting demand, bad master data is a silent threat that distorts decisions and drives up costs. What’s worse? Most businesses don’t realize the extent of the problem because they’re not measuring it.
Tracking the right MDM KPIs doesn’t just shine a light on data issues; it gives you a roadmap to solve them. This article breaks down the most essential MDM quality metrics, how to align them with your business goals, and what mistakes to avoid if you want to improve data trust and operational performance.
What Are MDM Quality Metrics?
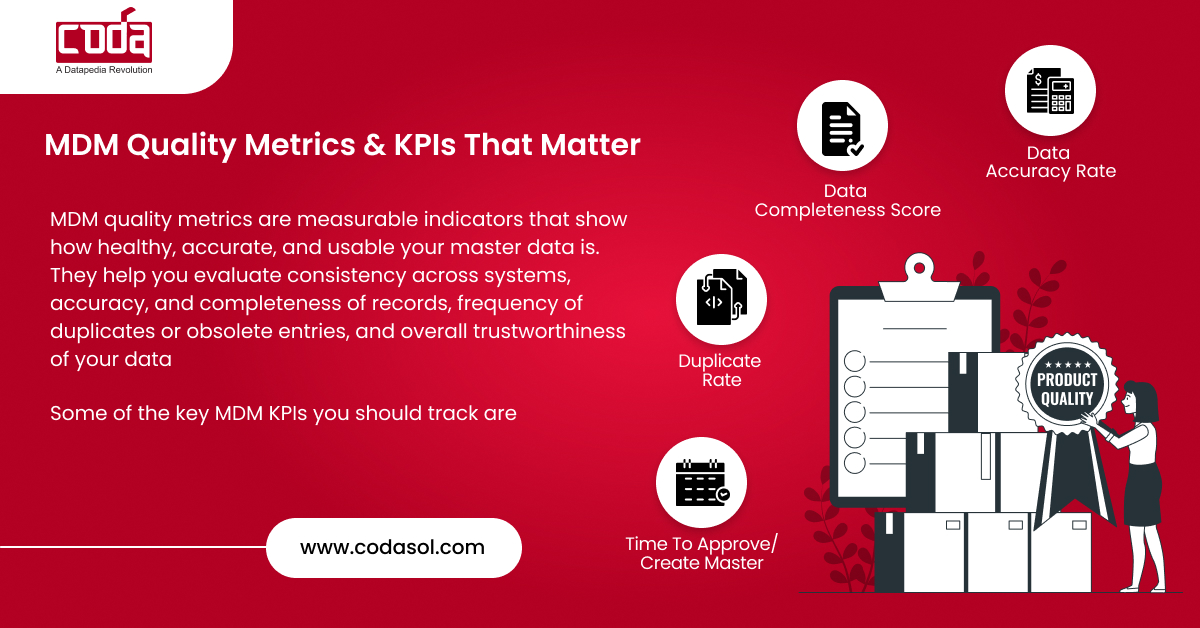
MDM quality metrics are measurable indicators that show how healthy, accurate, and usable your master data is. They help you evaluate:
- Consistency across systems
- Accuracy and completeness of records
- Frequency of duplicates or obsolete entries
- Overall trustworthiness of your data
Without these metrics, you’re flying blind. With them, you’re steering your data and your business in the right direction.
Top 5 Mistakes in Tracking MDM KPIs
Even well-intentioned MDM teams fall into traps when it comes to tracking data quality metrics. Avoid these common mistakes to ensure your KPIs actually drive improvement:
1. Tracking Too Many Metrics at Once
Having 20+ KPIs might sound thorough, but it usually leads to data fatigue. Focus on a core set of metrics that map directly to business goals.
2. Choosing Vanity Metrics
Some teams obsess over metrics that look good but don’t improve outcomes. For example, measuring total record count without considering accuracy or completeness offers no real insight.
3. Lack of Ownership
KPIs fail when no one is accountable. Assign specific KPIs to data stewards, domain experts, or department heads to ensure follow-through.
4. Not Benchmarking or Setting Targets
Without a target, a KPI is just a number. Define clear thresholds (e.g., <2% duplication rate) to assess success or flag issues.
5. Measuring Without Action
Perhaps the biggest mistake: collecting metrics but taking no corrective steps. A good KPI dashboard should trigger process changes, training, or system fixes when thresholds are breached.
MDM KPIs are not just for reporting; they’re tools for continuous improvement.
Key MDM KPIs You Should Be Tracking
Here are the most critical KPIs that matter across industries like Oil & Gas, Manufacturing, EPC, Utilities, and more:
| Metric | What It Measures | Why It Matters |
|---|---|---|
| Data Accuracy Rate | % of correct and verified entries | Reduces maintenance delays & supply chain issues |
| Data Completeness Score | % of fields populated correctly | Enables automation and smarter decision-making |
| Duplicate Rate | % of duplicate entries in material/vendor master | Leads to procurement waste and inventory bloat |
| Time to Approve/Create Master | Avg time to process new entries | Affects business agility and system usability |
| Data Standardization Score | % of entries following defined naming conventions | Improves searchability and interdepartmental use |
| Data Usage Rate | How often a data field is accessed/used | Unused fields = poor design or irrelevance |
| Master Data Change Success Rate | % of error-free change requests | Indicates governance efficiency |
How to Choose the Right MDM KPIs for Your Business
Not all metrics are equal. Your business priorities should drive which KPIs to focus on.
Here’s how to align your KPIs with outcomes:
- If you’re in Oil & Gas or EPC → Track Data Accuracy Rate and Change Success Rate to reduce safety risks and shutdowns.
- If you’re in Manufacturing → Focus on Duplicate Rate and Standardization Score to streamline procurement and BOM creation.
- If you’re in Healthcare or Government → Emphasize Completeness and Approval Time to meet compliance and audit needs.
Pro tip: Don’t track too many metrics at once. Start with 3–5 that tie directly to business pain points.
What Poor Metrics Can Cost You
Let’s say you manage procurement in a steel plant with 100,000 material line items.
After a data audit, you find that 12% of the materials are duplicates.
Here’s the math:
- Inventory value = $28,000,000
- 12% duplication = $3,360,000 tied up in redundant stock
- Payback period for fixing it (with a data quality solution): 6 months
- ROI = 3.36x within the first year
Now imagine running procurement without knowing this.
That’s the cost of not measuring your data health.

Want a health check on your current MDM KPIs? Schedule a free data audit with our experts
How to Track and Improve MDM KPIs
Use this simple framework:
1. Define Your Metrics
Start with a focused list of 5–7 KPIs aligned with your department’s goals.
2. Set Benchmarks
Use internal baselines or industry references. Example:
- Best-in-class duplicate rate = <2%
- Average material data completeness = 85%
3. Implement Monitoring Tools
Use MDM platforms that offer:
- Automated quality checks
- Dashboard-based KPI tracking
- Alerts for anomalies
CODASOL’s PROSOL platform offers out-of-the-box tracking for all these KPIs, integrating seamlessly with SAP, Maximo, and Oracle.
4. Govern With Accountability
Assign metric ownership:
- Procurement → Duplicate rate
- Engineering → Change success rate
- IT → Standardization and completeness
5. Review Monthly or Quarterly
Treat data health reviews like financial reviews because they’re that critical.
MDM KPI Dashboard Template
If you’re just starting out, here’s a simple dashboard layout that works for most industries:
| KPI | Current Value | Target | Trend | Owner | Action Required |
|---|---|---|---|---|---|
| Data Accuracy Rate | 92% | ≥ 98% | ⬆ Improving | QA Lead | Continue validation audits |
| Duplicate Rate | 8% | ≤ 2% | ➡ Flat | Procurement | De-duplication project needed |
| Completeness Score | 76% | ≥ 90% | ⬇ Declining | IT/Data Team | Form redesign, user training |
| Approval Time (Avg Days) | 6.5 | ≤ 3 | ⬆ Worsening | Master Data Team | Workflow automation review |
| Change Success Rate | 88% | ≥ 95% | ➡ Stable | Engineering | Manual errors to be audited |
This dashboard helps teams quickly see what’s working, what’s not, and where to focus effort.
The Role of E-E-A-T in MDM Quality
To build trust in your data:
- Ensure expert validation of business-critical entries
- Document your data sourcing and cleansing rules
- Involve domain experts in naming conventions and classification
This ensures Experience, Expertise, Authoritativeness, and Trust; not just in your MDM content, but in your data itself.
Frequently Asked Questions
1. What are the top KPIs for Master Data Management?
The most important include: data accuracy, completeness, duplicate rate, time to approve/create, and change success rate.
2. How often should I measure my MDM quality metrics?
Ideally monthly, and at minimum quarterly. For high-impact industries like Oil & Gas or Aviation, real-time monitoring is recommended.
3. What is a good duplicate rate benchmark?
Under 2% is considered world-class. Anything above 5% indicates a need for immediate intervention.
4. Can I automate KPI tracking?
Yes, modern MDM platforms like PROSOL offer built-in dashboards, alerts, and trend analytics for real-time insights.
5. What if I don’t know where to start?
Begin with a free MDM assessment to uncover your baseline and work your way up with tailored KPIs.
6. How do I start tracking MDM KPIs with no tool in place?
You can begin with Excel or Google Sheets, using manual inputs from key teams. Define 3–5 high-impact KPIs and start simple.
7. What’s the biggest challenge in implementing MDM KPIs?
Getting buy-in across departments. MDM isn’t just an IT issue; it requires alignment across procurement, engineering, finance, and operations.
8. Can KPIs evolve over time?
Absolutely. As your data matures or your priorities shift (e.g., from cleansing to governance), your KPIs should adapt accordingly.
Final Word
You wouldn’t drive a car without a dashboard.
Why manage business-critical data without one?
Start tracking your MDM quality metrics now, and turn your data into a strategic asset, not a silent liability.
80% of Enterprise Data Is Inaccurate. Fix Yours Now.
Discover how our AI-powered MDM platform transforms scattered, duplicate, and incomplete data into a single source of truth, so you can move faster, cut costs, and make confident decisions.